60 lines
2.6 KiB
Markdown
60 lines
2.6 KiB
Markdown
|
|
---
|
||
|
|
title: Us State Map Visualization Using D3js
|
||
|
|
---
|
||
|
|

|
||
|
|
|
||
|
|
## Project Explanation:
|
||
|
|
|
||
|
|
**We have the sample data of US States:** Number of serious accidents reported for every state in US.
|
||
|
|
|
||
|
|
_We have this data in three categories:_ Lowest reported number for a month, Average reported accidents in a year and Highest number reported in a month, as showed in below sample data.
|
||
|
|
|
||
|
|
We want to draw a US Map and visualize this data such that, when we hover mouse over a state, it should show this data for that particular state.
|
||
|
|
|
||
|
|
## Sample Data:
|
||
|
|
|
||
|
|
`AZ: 13 41 57`
|
||
|
|
|
||
|
|
`CA: 41 60 81`
|
||
|
|
|
||
|
|
`NY: 6 35 54` and so on.
|
||
|
|
|
||
|
|
## Hints and Resources:
|
||
|
|
|
||
|
|
### Step by Step instructions:
|
||
|
|
|
||
|
|
* First , we will need to create a US map.
|
||
|
|
1. You can either create a map from scratch using sources like - <a href='https://intridea.github.io/stately/' target='_blank' rel='nofollow'>Stately.</a>
|
||
|
|
|
||
|
|
2. Get a already created map from <a href='http://freehtml5maps.com' target='_blank' rel='nofollow'>freehtml5maps</a> or use this <a href='http://bl.ocks.org/NPashaP/raw/a74faf20b492ad377312/3513ad985b2fa93ea35f2fc864cb30540c298171/uStates.js' target='_blank' rel='nofollow'>Javascript</a>
|
||
|
|
* Add your map to the main javascript used for visualization
|
||
|
|
|
||
|
|
For Example, `(script src="uStates.js")(/script) (!-- creates uStates. --)`
|
||
|
|
|
||
|
|
* Create Div tag to hold tooltip and create SVG to hold you map.
|
||
|
|
|
||
|
|
For Example,
|
||
|
|
|
||
|
|
`javascript
|
||
|
|
(div id="tooltip")(/div)
|
||
|
|
(svg width="960" height="600" id="statesvg")(/svg)`
|
||
|
|
|
||
|
|
* Create Tooltip function to create html content string in tooltip div.
|
||
|
|
|
||
|
|
This tooltip function will return a table and this table will be shown whenever we hover mouse over the state Table should be something like this ( As shown in the first figure) : Arizona Low 13 Average 41 High 57
|
||
|
|
|
||
|
|
* Draw states on id (#statesvg in our example ) with data and tooltip function.
|
||
|
|
|
||
|
|
For example, `uStates.draw("#statesvg", sampleData, tooltipFunc);`
|
||
|
|
|
||
|
|
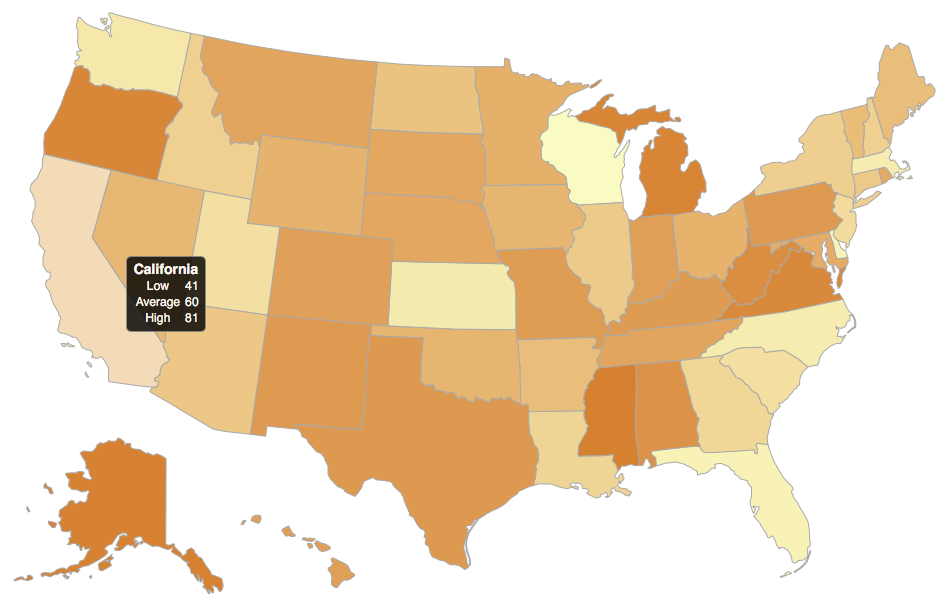
**Final output will be something like this: ( Hovered the mouse over California )**
|
||
|
|
|
||
|
|
|
||
|
|
|
||
|
|
## References:
|
||
|
|
|
||
|
|
1. <a href='https://d3js.org' target='_blank' rel='nofollow'>**D3.js**</a> Examples and Documentations.
|
||
|
|
2. <a href='https://github.com/NPashaP' target='_blank' rel='nofollow'>**NPashaP GitHub**</a>
|
||
|
|
3. <a href='https://intridea.github.io/stately/' target='_blank' rel='nofollow'>**Stately**</a>
|
||
|
|
4. <a href='http://freehtml5maps.com' target='_blank' rel='nofollow'>**FreeHTML5Maps**</a>
|