3.5 KiB
| title |
|---|
| Wireshark |
Wireshark
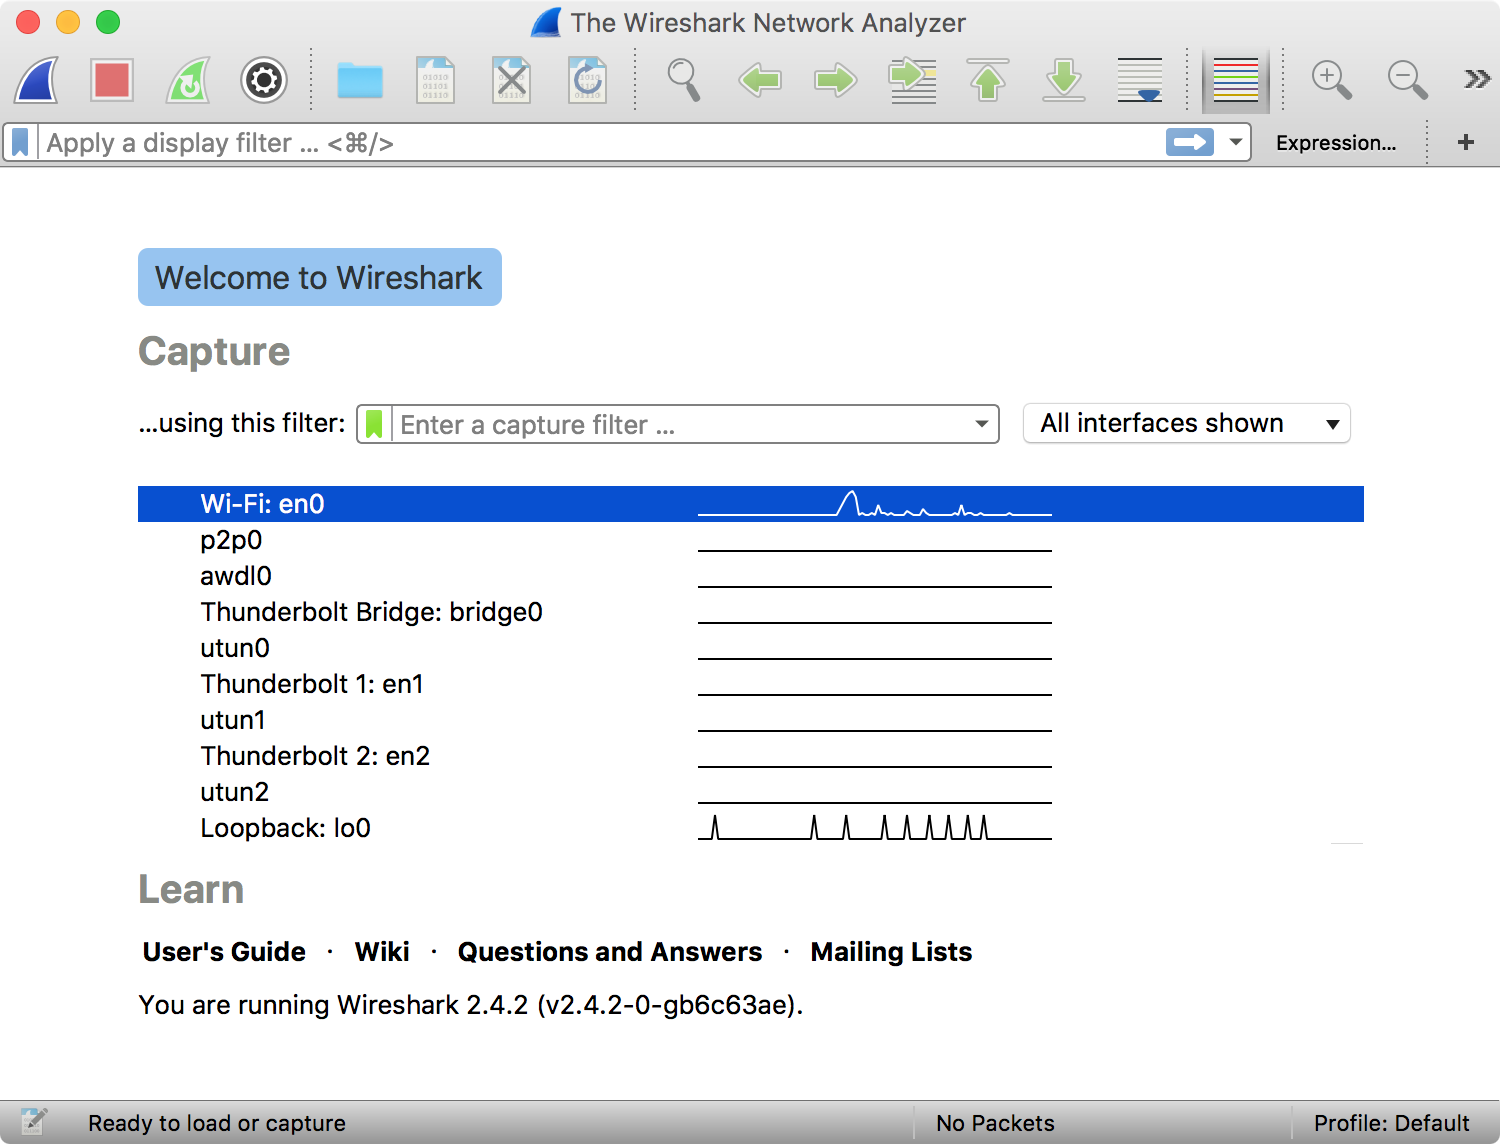
Wireshark is an open source network analyzer application that is available for Linux, macOS and Windows. It allows you to "sniff" packets being sent to and from different nodes on a network.
Features of wireshark:
- Supports more than 1,000 protocols
- Ability to do live capture and offline analysis
- Has the most powerful display filters in the industry
- Captured network data can be displayed via GUI or via a command-line TShark tool
- Able to read/write many different capture file format such as tcpdump (libpcap), Network General Sniffer, Cisco Seure IDS, iplog, Microsoft Network Monitor, and more
- Live data can be read from IEEE 802.11, Bluetooth, and Ethernet
- The output can be exported to XML, PostScript, CSV, and plaintext
Why use Wireshark?
Wireshark is a powerful tool you can use to:
- Learn about how different protocols are used in networking
- Troubleshoot network problems
- Analyze traffic going through your network
- Analyze the data your software is communicating to remote servers
- Verify that data is being properly encrypted before being sent
- Development of network communication protocols
- Check for Trojans or other malicious software on your computer
How do I get started?
To use Wireshark in its most basic form:
- Download and install the application.
- Select the
interfaceyou would like to capture packets on, this will most likely be your ethernet or WiFi adapter. - Watch the pretty stream of color coded packets and let the application capture them for as long as you want.
- When you have enough packets, select the stop button.
- Save your captured packets if you want to keep them for ongoing analysis. This is done as a
.pcapfile which is a standard format for packet captures.

Analysis, Filtering and Inspection
Now you have a bunch of packets, but what does it all mean? The different colors you saw indicate different types of traffic. By default some of the colors are:
- Light purple - Transmission Control Protocol (TCP) packets;
- Light blue - User Datagram Protocol (UDP) packets;
- Black - Errors
Note: These colors can all be customized but be mindful that each packet might fit into more than one category, so you must also prioritize these rules.
Filtering your packets is a quick way to find what you are looking for. Simply type in the text input at the top of the window to show only packets that match your query. For example if you were looking at HTTPS traffic, enter ssl into the filter. This will show all packets related to HTTPS connections.
Now that you have found some relevant packets, select one to view more details about it. Depending on the type of packet you inspect, this will give you lots of detailed information. Some basic details will include:
- Protocol used
- Source address and port
- Destination address and port
- Response times
More Information:
Wireshark.org
Wireshark - Wikipedia
How to Use Wireshark to Capture, Filter and Inspect Packets - How to Geek