1.4 KiB
| title |
|---|
| Piecewise Functions Graphs |
Piecewise Functions Graphs
Piecewise functions are defined differently for different intervals of x. In order to find y, you use x to look up what interval it's in. Let's take a look at a simple piecewise function and its graph.
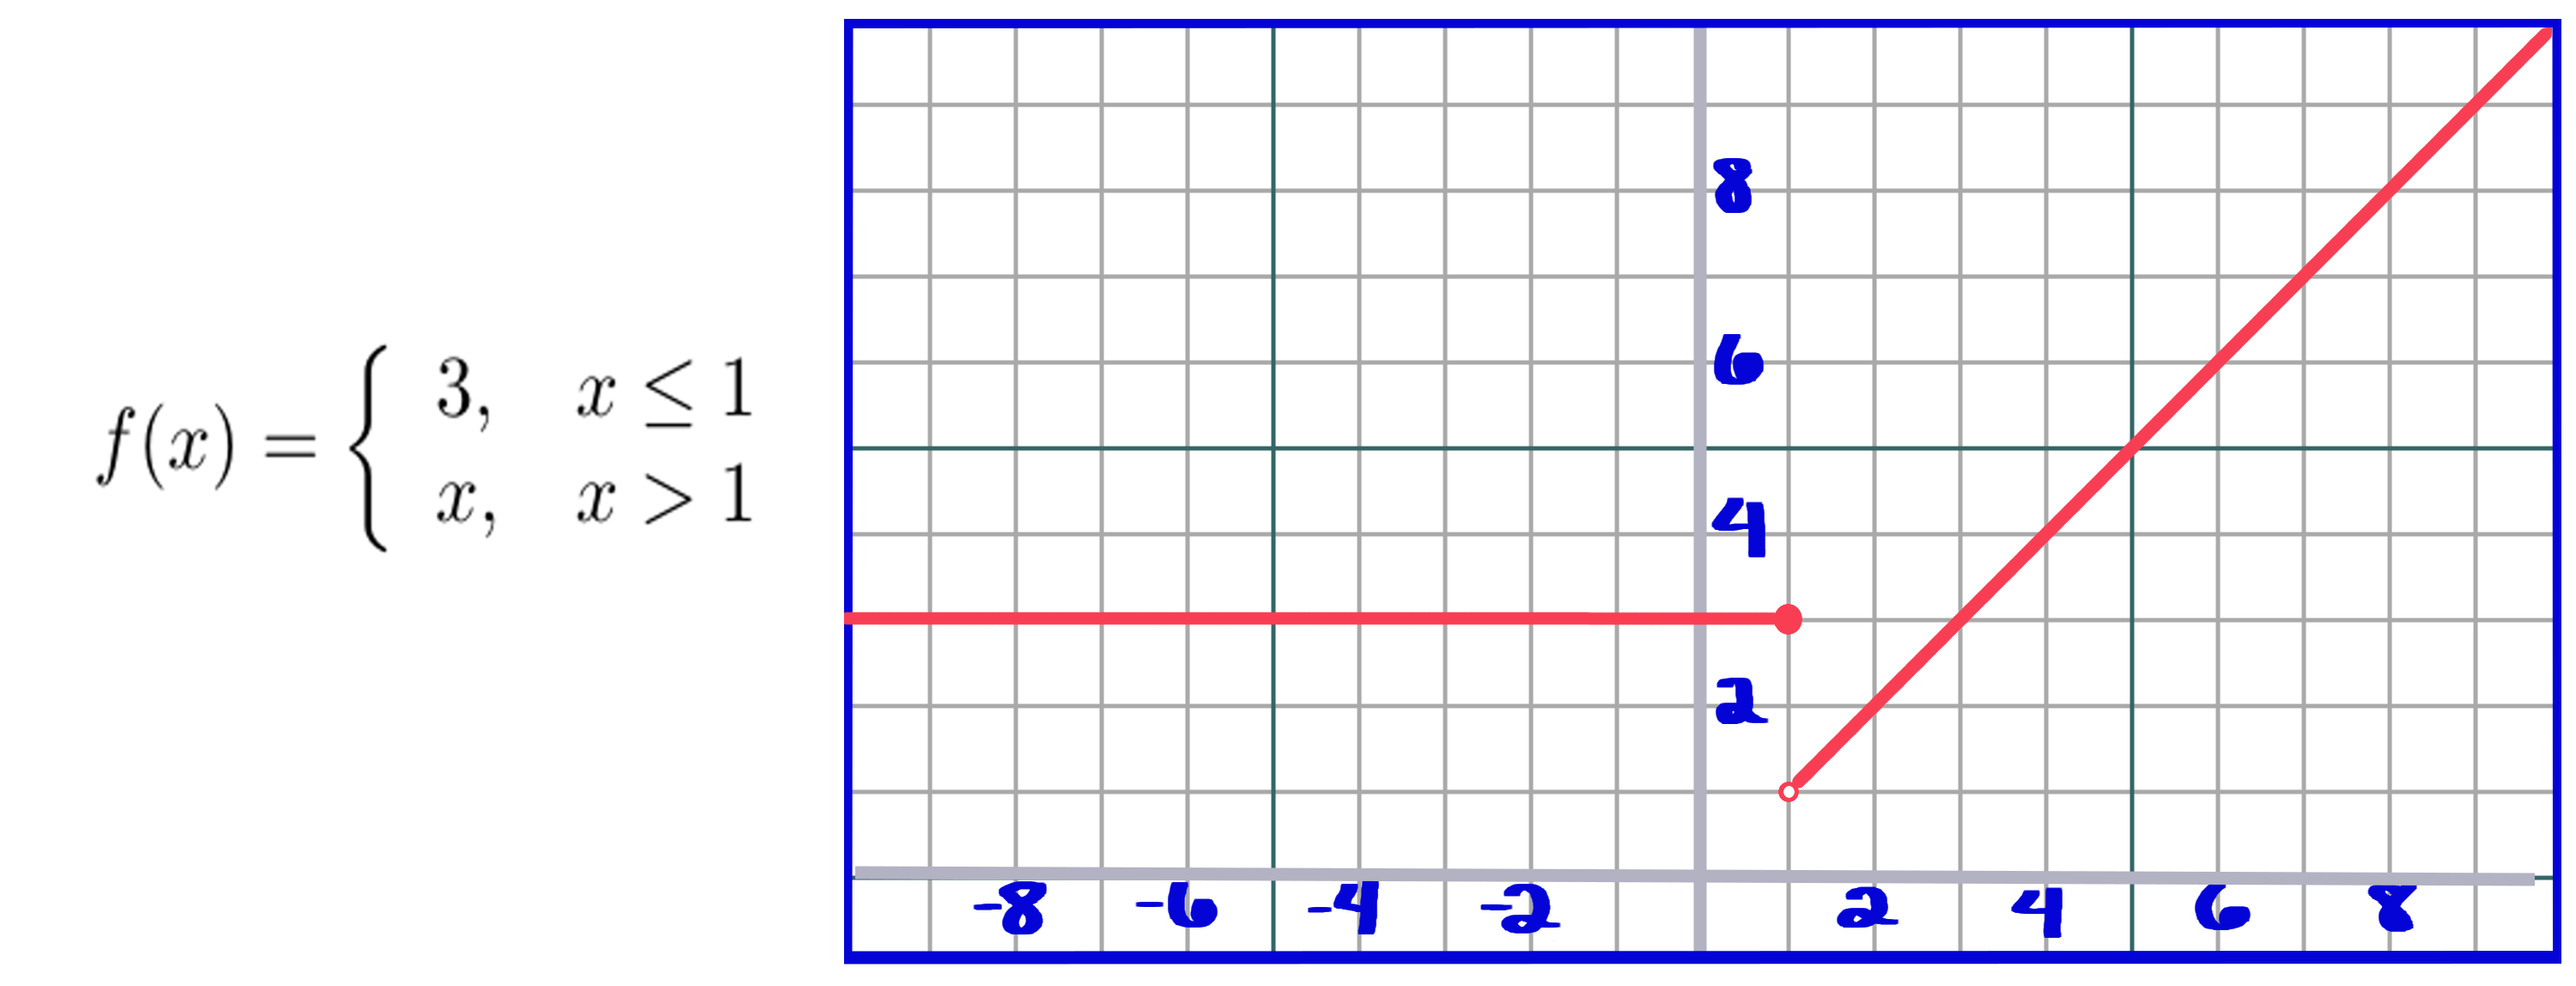
You can see that when x is less than or equal to 1, y is equal to 3, and when x is greater than 1, y is equal to x. It's almost like piecewise functions are created by combining different functions into one.
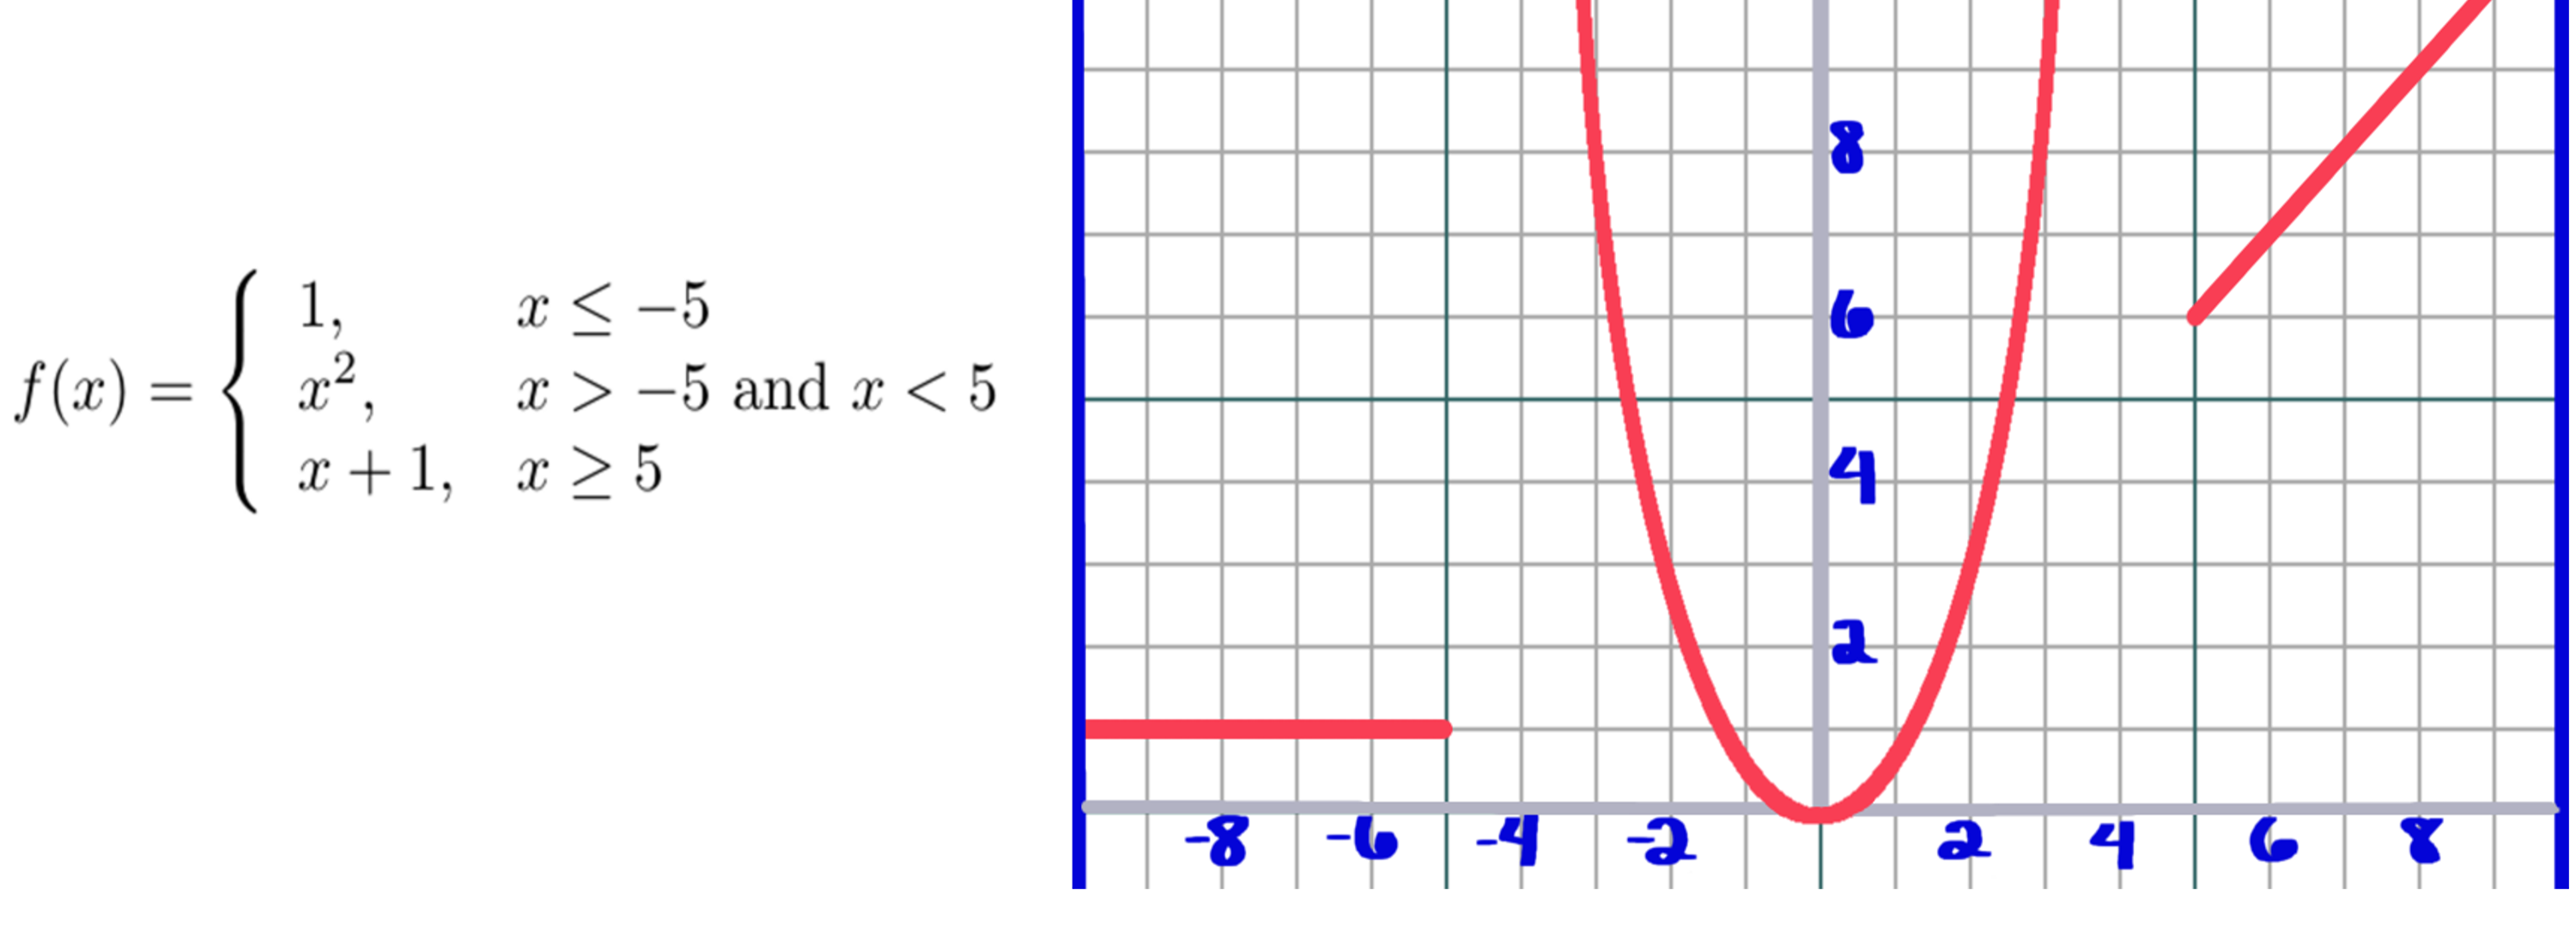
In the graph above you can see that x squared could be a standalone function which would be defined for all real numbers. Instead we've defined our piecewise function so only values of x that are greater than -5 and less than 5 are input in to x squared. Notice that this graph appears to have two "boundary lines" at x = -5 and x = 5, and the first graph has one "boundary line" at x = 1.
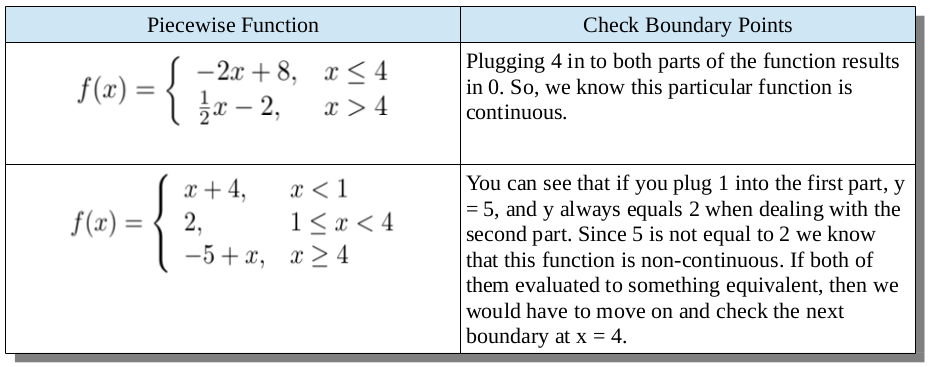
Continuous/Non-continuous Piecewise Functions
How can you tell if a particular piecewise function is continuous? Let's look at a couple examples.