31 lines
1.7 KiB
Markdown
31 lines
1.7 KiB
Markdown
---
|
|
title: Reading Box Plots
|
|
---
|
|
## Reading Box Plots
|
|
|
|
Box Plots might seem unintuitive at first glance, but they are a great way to convey a lot of information of a compact format. Here's how you can read the informations contained in a
|
|
Box Plot:
|
|
|
|
|
|
|
|
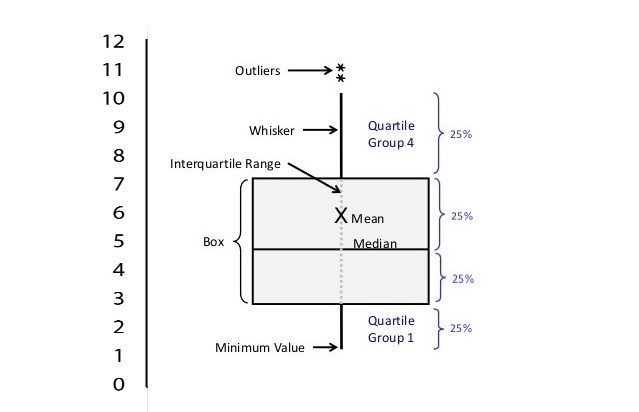
The Box Plot has several elements that we can recognize:
|
|
* The box, which is bisected in two parts
|
|
* Two whiskers, above and below the box
|
|
* Possibly some scattered points: the outliers
|
|
|
|
Each section of the box plot represents the interval of a quartile of the population of data. What this means, is that 25% of the data lies within the two ends of the lower whisker, 25% within the interval spanned by the bottom of the box and the median line, 25% within the median and the top of the box, and 25% in the upper whisker. Any statistical outlier is represented as a point outside of the box.
|
|
|
|
In the example reported above we would have (using approximate numerical values):
|
|
* a quarter of the data between 1 and 3 (lower whisker)
|
|
* a quarter of the data between 3 and 5 (lower part of the box)
|
|
* a quarter of the data between 5 and 7.5 (upper part of the box)
|
|
* a quarter of the data between 7.5 and 10 (upper whisker)
|
|
* two outlier points above the boxplot
|
|
|
|
Notice that the line that bisects the box represents the **Median** (50th percentile) and **not the Mean**.
|
|
|
|
#### More Information:
|
|
For more informations:
|
|
* <a href='https://en.wikipedia.org/wiki/Box_plot' target='_blank' rel='nofollow'>Wikipedia: Box Plot</a>
|
|
* <a href='https://www.khanacademy.org/math/probability/data-distributions-a1/box--whisker-plots-a1/v/interpreting-box-plots' target='_blank' rel='nofollow'>Khan Academy: reading Box Plots(video)</a>
|